Nick Valdez
My portfolio of equity stocks was generated by enumerating all possible subsets portfolios of s&p 500 member companies and back-testing my trading strategy on each subset to see which stocks performed best with my strategy.
Below is a table of the top 5 portfolios that performed best with my strategy according to back-testing results.
The chart is dynamic and gets updated daily based on back-testing results that get re-computed every two hours in order to quickly adapt to any significant or deviant market conditions.
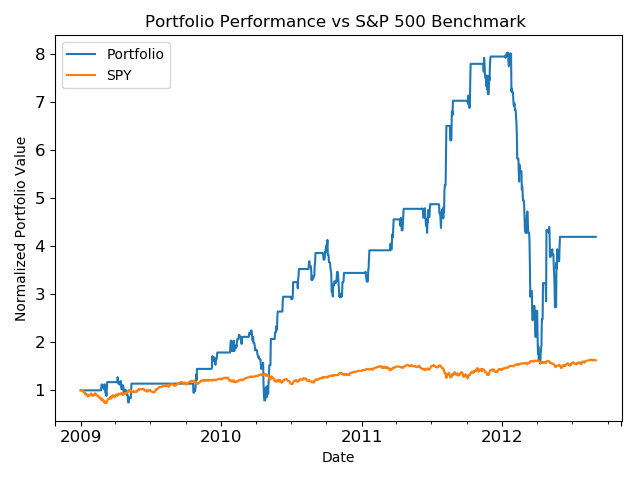
I used a few technical indicators and some rules to make buy and sell decisions based on the techinical indicators. Results of the algorithm performance are shown below.
"According to L. Jay Tenenbaum, his successor on the risk arbitrage desk, the trick in those days required less of a reliance on fancy models or sophisticated financial instruments than on instinct and good manners."
A model dependent on running simple linear regressions through data points generally does a poor job predicting future prices in complex, volatile markets marked by freak snowstorms, panic selling, and turbulent geopolitical events, all of which can play havoc with commodity and other prices. Zuckerman, Gregory. The Man Who Solved the Market (p. 83). Penguin Publishing Group. Kindle Edition.

work in progres..